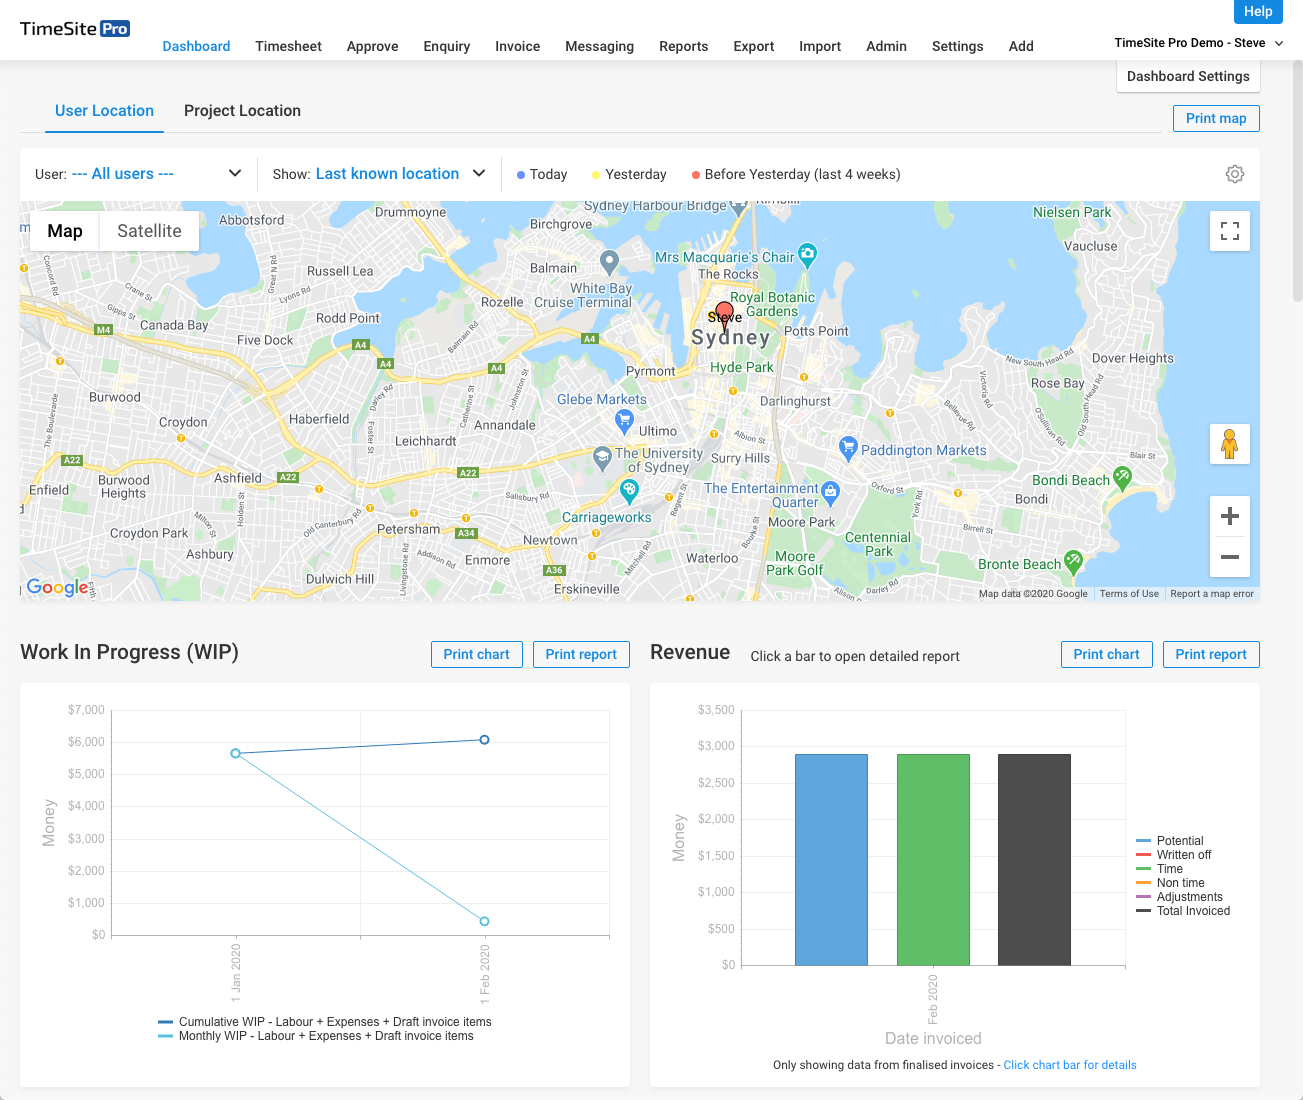
The Dashboard screen provides a variety of different graphs and tables that can be used by your managers and account administrators to track different KPIs and status. Many of these widgets provide chart and report printing options.
- User Location
- Project Location
- Key Performance Indicators
- Budget
- Timesheets & Billable Hours
- Kiosk
- Reports
User Location
You can use the User Location option on the map to see where your staff are or have been over the last few days. When they save a timesheet record or clock-on/off on their mobile phone or tablet, they also record their GPS location. This is a privacy setting on the device which requires your user to approve. You can enable GPS tracking in Settings > System Settings > Features > GPS > Enable GPS Logging.

- Hover your mouse over the coloured pin and click to bring up a tooltip with more information.
- Click on the User pulldown to select a specific user.
- Click on the Show pulldown to display Movement or Last Known Location.
- Click on the "gear" icon in the top right to display the GPS Settings panel. You can use this panel to send your staff a link to our mobile app on the Apple and Google app stores.

- Click on the Print map button to display the print menu.
Project Location
You can use the Project Location option on the map to see where your projects are located. The project (or job site) address is specified in Admin > Project > [select project] > Geofence. You can enable Geofencing in Settings > System Settings > Features > GPS >Enable Geofencing.
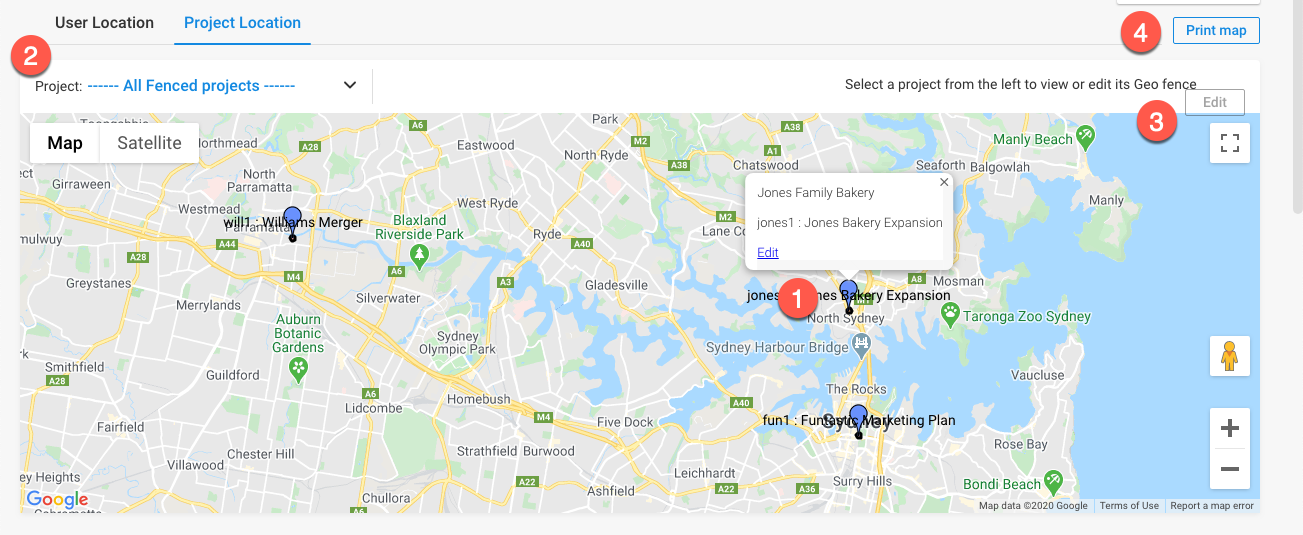
- Hover your mouse over the coloured pin and click to bring up a tooltip with more information.
- Click on the Project pulldown to select a specific project to display on the map.
- If a project is selected in the Project pulldown, you can click on the Edit button to go to the Project > Geofence panel to edit the address.
- Click on the Print map button to display the print menu.
Key Performance Indicators
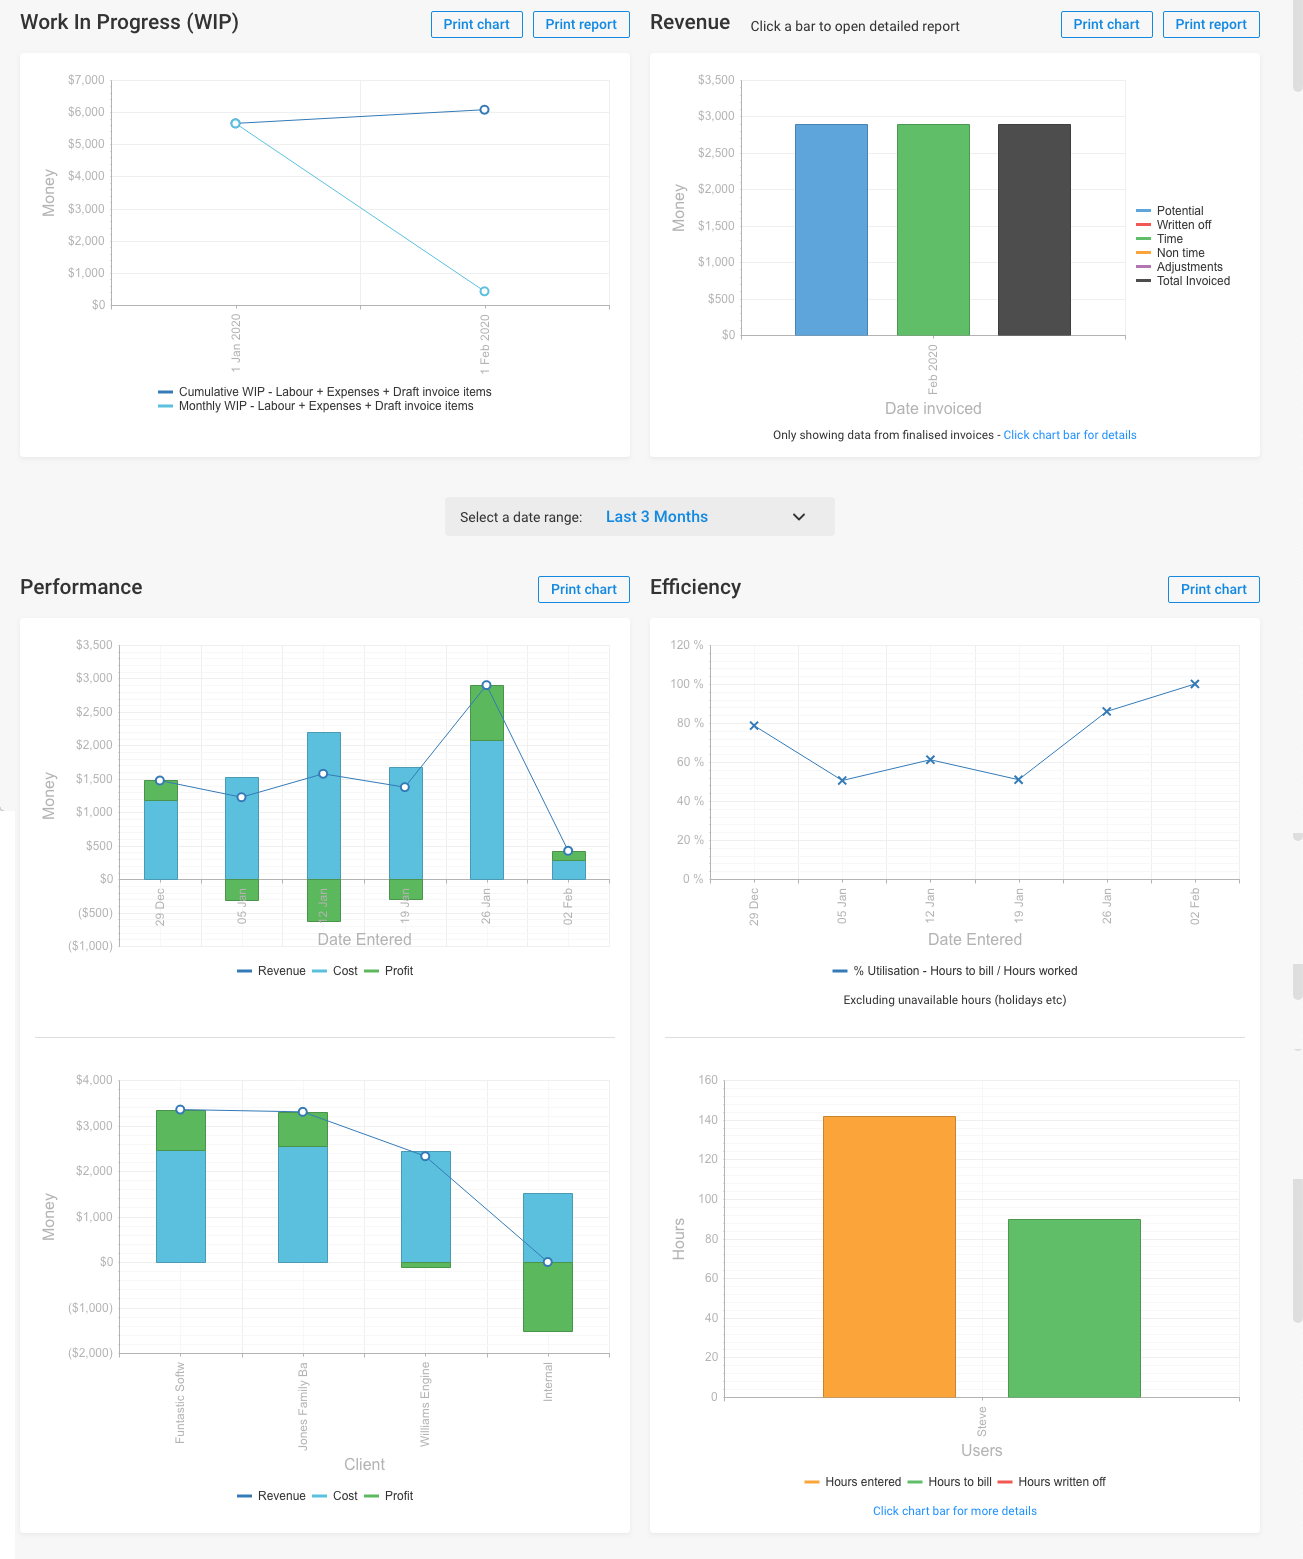
The next section of the Dashboard displays six KPIs that are particularly useful to management. They can be printed out either as a chart or you can print a more detailed report.
Budget
You can track progress again budget for all active projects that have a budget set. Click on the edit (pencil) icon go to the project record, click on the Finance tab to edit the project's budget details.

Timesheets & Billable Hours
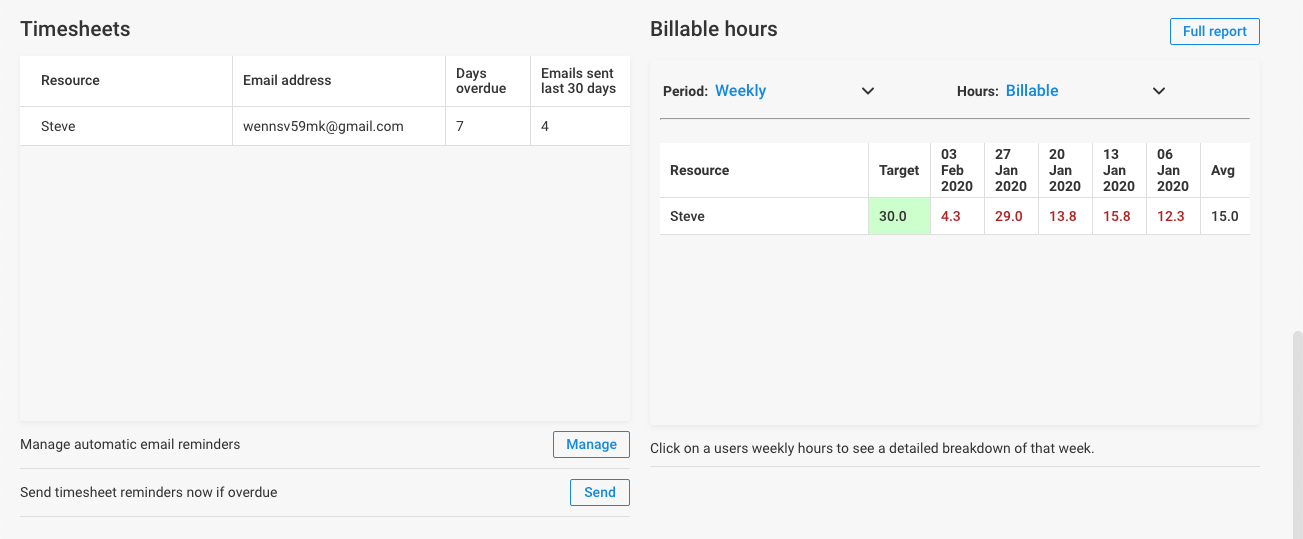
You can track the status of any timesheets that have not been completed or submitted. You can see how many days overdue the timesheet is and the number of reminder emails sent. The Billable Hours table enables you to monitor:
- Billable hours
- Worked hours
- Target Billable hours
- Utilisation
Click on the Full report button to display a more detailed report that can be printed out.
Kiosk
You can monitor which staff have clocked in via our Kiosk mode. The Kiosk widget will also display the user's location at the Kiosk if this is available.

Reports
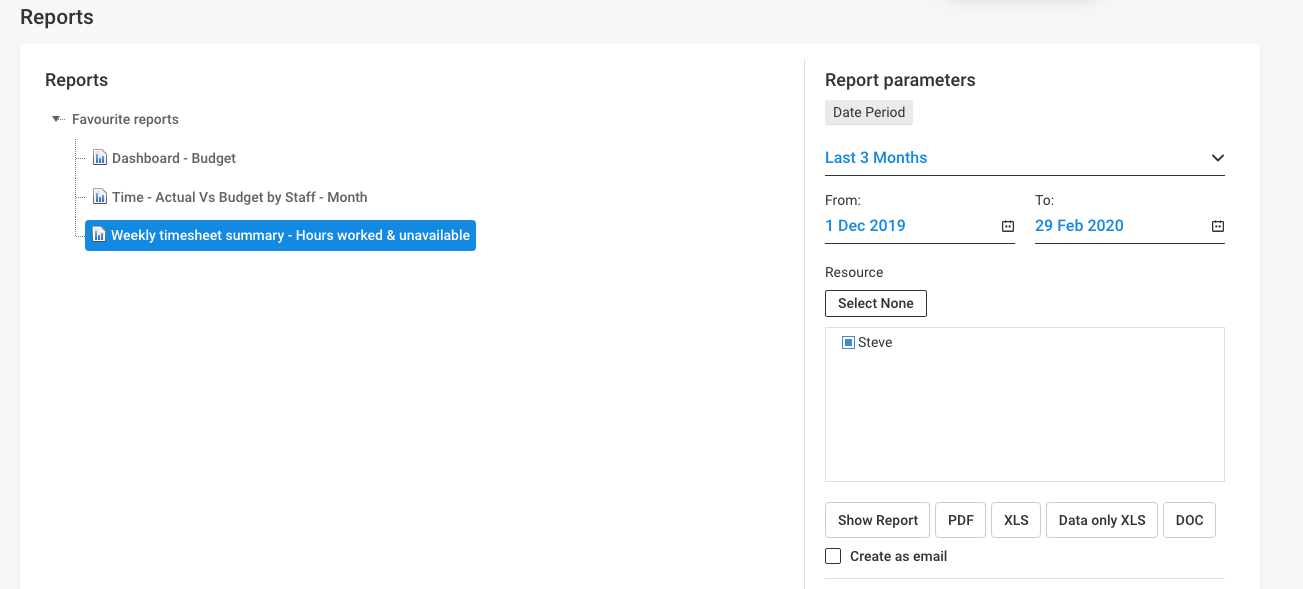
You can specify that certain reports are to be displayed on the Dashboard in either the Reports screen or Settings > Report Management. When you select a report, the report's parameters will be displayed, and the report can be displayed or printed from the Dashboard.
Comments
0 comments
Please sign in to leave a comment.